When in Doubt, Make a Cumulative Record
Author: Andy Lattal, PHD
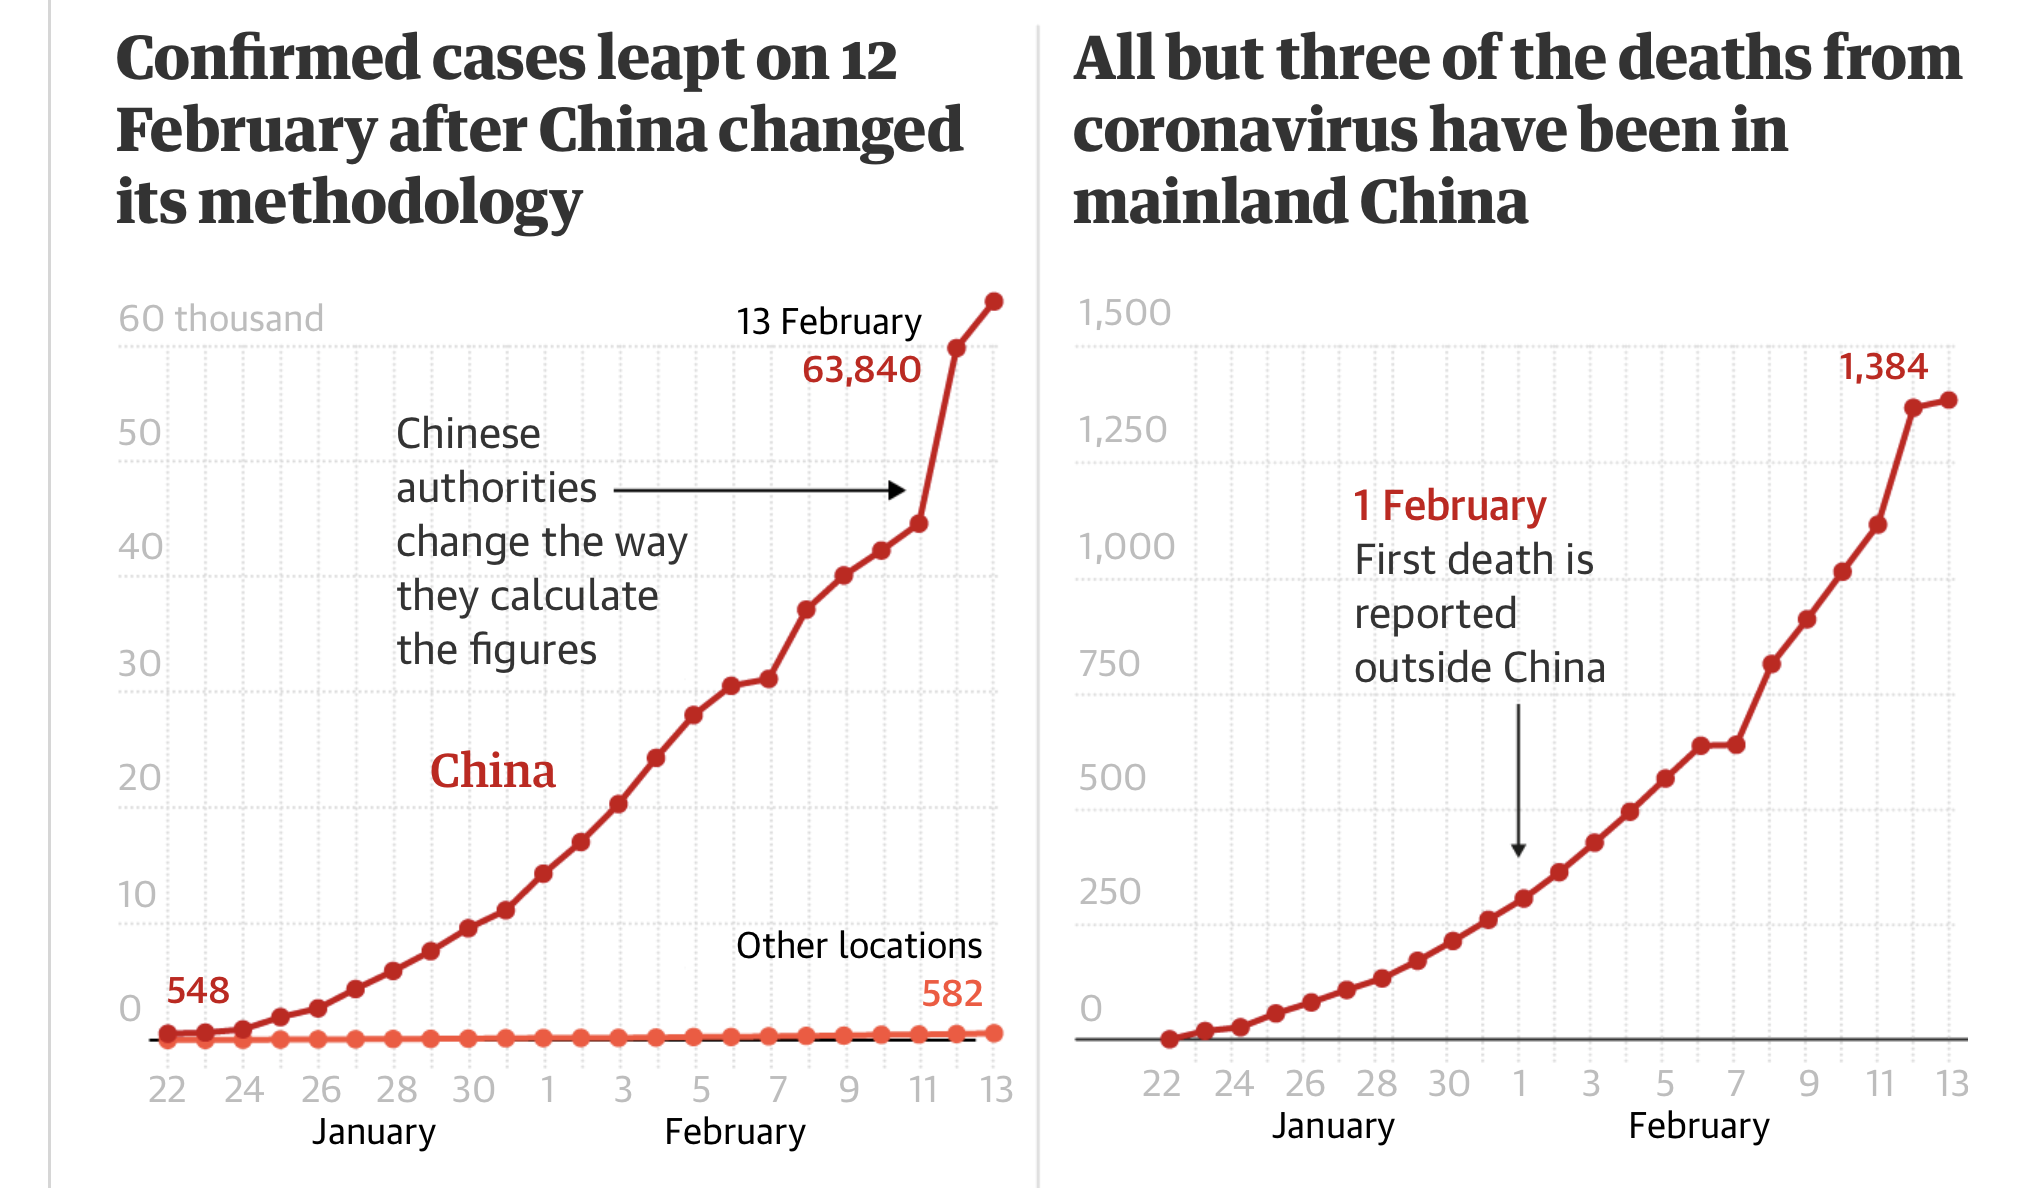
Contrary to a popular myth among many behavior analysts, Skinner invented neither the cumulative record nor the cumulative recorder. The origins of cumulative frequency plots, as they were known, date back to at least a couple of centuries ago, and now appear frequently in popular media. Consider, for example, the cumulative record below from an article in the British newspaper The Guardian, dated February 15, 2020. This graphic shows the growth in time of the number of cases of coronavirus and number of deaths by days over the period 22 January 2020 to 13 February 2020. Particularly notable is the increase in the rate of cases reported between February 11 and 12. These records are identical to records used to plot responses in real-time in behavior analysis research, applied or basic. They allow us to see the steady growth in the number of cases reported, as well as the rate at which the coronavirus is spreading and killing. In the left graph, compare the slope of the line between January 22 and February 5 and the slope from February 6 to February 13. Which is steeper? What does this tell you about the rate of occurrence of the virus?
Even though he didn’t invent them, Skinner certainly brought cumulative records to the forefront of psychology with his experimental analysis of behavior. His student, Ogden Lindsley also developed the standard celeration chart, which is simply a cumulative record that is produced as a straight line rather than one with the curves and peaks used in most experimental designs today. Cumulative records in psychology are not just for lab nerds who go about spewing terms like “DRLs,” “mixed,” “interpolated,” “tandem,” and the like. Their great value is in allowing a permanent record of behavior in real-time, as opposed to just a summative number of some events over some time period, like “response rate” or “number of food refusals.” Of course, the latter is important, but it also is important to know how those 15 food refusals were distributed in time and in relation to other things happening at those times. Cumulative records showing each response in a time-space allow that to happen.
Many, many years ago, when I was a boy, my favorite aunt gave me some stickers with my name on them to put in my books. The stickers had a picture of Mickey Mouse on a flying carpet with the caption “A book is like a magic carpet.” (I still have many of those books, all proudly displaying their stickers). Today, cumulative records are my magic carpet, allowing me to see relations I could never otherwise have seen and to do things I never otherwise could have done. Want to manage something about yourself, Andy? Break out the cumulative record and get a ‘recordin’! Here are a couple of personal examples. Faced with a daunting task of editing more than 90 manuscripts I received for a special issue of a journal, I was overwhelmed until I remembered that cumulative records allow one to see one’s behavior over an extended period and in real-time. I set a goal for myself of completing one manuscript a day for 90 days. I then made a graph with 90 equal units in either direction from the origin, with cumulative manuscripts reviewed on the y-axis and days along the x-axis. Drawing a diagonal line from the origin provided a target of one manuscript completed a day. As long as my daily data points stayed on the line, I was on my target rate of one per day. If my data path fell above the target line (if, for example, I did two manuscripts one day), well, I was golden. If it fell below the target line, I was in trouble. The higher above the target line I got, the more rewarding it was, and the lower below the line I fell, the more in trouble I became. End of story: I finished my task in 90 days, on the target line. Across those 90 days, the data path deviated from time to time, but never by more than two manuscripts either way. I still have the cumulative record some twenty-odd years later.
As another example, weight management is a complicated issue, but a major step can be taken by creating a cumulative weight-loss record, especially if a target line is added to it. Daily weighing (same time, whether you want to get on that scale or not) followed by plotting provides immediate, objective, visual feedback on how you are doing over time in reaching the target. I am always surprised at how well a simple graph can control one’s behavior. Off the line in a positive direction means that you are ahead of the game. Off the line in the other direction and it is time to give up the dark-chocolate, late-night snack! I do not wish to minimize or oversimplify difficult behavior-management problems or suggest that the cumulative record is the panacea to every human weakness and bad habit. Neither, however, do I want to wring my hands about how complicated behavior management is, or fail to recognize that this quite simple tool is among the most powerful ways to help people resolve their own problems, as well as the problems of those they treat. Cumulative records are not just for lab nerds; they are for us all